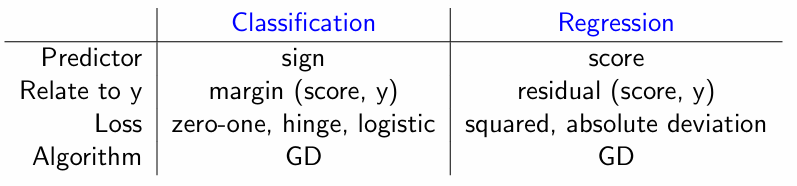
Simple comparison table:
NOTE: When evaluating a model, make sure not to forget the following:
Compare training metrics vs. test metrics (measure of under/overfitting)
Compare test metrics vs. baseline metrics (measure of how well the model works, use the test set when calculating the baseline)
Baseline calculation for regression tasks : where is the mean of values (the baseline is we are assuming the prediction is always the mean value of the training set). For classification tasks, you can use the default ratios. For example if 60% of the rows are of the positive class (1), then the baseline accuracy is 60% (meaning that even if you pick randomly from the dataset you can’t do worse then 60%, your model shouldn’t do worse too!).
For every model you train, do not forget to compare the results with the baseline!
Never train the model and tune hyper-parameters using the testing set. It leads to bad generalization! In other words, split your testing set in the beginning and never touch it until the end (create a validation set instead).
Classification Metrics
| Pred/Actual | 0 | 1 |
|---|---|---|
| 0 | True Negative (TN) | False Negative (FN) |
| 1 | False Positive (FP) | True Positive (TP) |
Accuracy: The proportion of correct predictions out of all predictions. It’s a good starting point but can be misleading with imbalanced datasets.
Precision: The ratio of correctly predicted positive observations to the total predicted positive observations. A high precision means your model has a low number of false positives.
Recall (or Sensitivity): The ratio of correctly predicted positive observations to all observations in the actual class. A high recall means your model has a low number of false negatives.
F1-Score: The harmonic mean of Precision and Recall. It provides a single score that balances both metrics, which is especially useful for imbalanced datasets.
Regression Metrics
To be continued…
Bias and Variance
Underfitting and Overfitting
Underfitting:
- Low-dimensional
- Heavily regularized
- Bad modeling assumption
Note: High bias = Model consistently misses relevant patterns (underfitting)
Overfitting:
- High dimensional or non-parametric
- Weakly regularized
- Not enough data
Note: High variance = Model is overly sensitive to training data (overfitting)
Regularization
Core idea: For any model with parameters :
- L1 Regularization: Add
- L1 Constraint
- L2 Regularization: Add
- Elastic Net