Line fitting finds the line that best explains a cloud of 2D points. “Best” is defined by an error measure, and two common choices behave quite differently.
Two Ways to Measure Error
| Method | Line model | What is minimized | Notes |
|---|---|---|---|
| Ordinary least squares (OLS) | Vertical distances | Closed form. Cannot represent vertical lines. Assumes x is exact. | |
| Total least squares (TLS) | with | Perpendicular distances | Treats x and y symmetrically. Handles any orientation. |
For image points both coordinates are measured with noise and lines can be at any angle, so TLS is the natural choice.
Total Least Squares via SVD
With a unit normal , the signed distance of a point from the line is simply
so the squared error is . The solution has two parts:
- The best line passes through the centroid of the points.
- Center the data, (an matrix), and take its SVD, . The first right singular vector (first row of ) is the direction of greatest spread, the line’s tangent. The second is the normal , direction of least spread.
- Set .
def fit_line(points):                      # points: n x 2
    mean = points.mean(axis=0)
    _, s, vt = np.linalg.svd(points - mean)
    a, b = vt[1]                           # normal = direction of least variance
    c = -(a * mean[0] + b * mean[1])
    return np.array([a, b, c])             # ax + by + c = 0, with a^2 + b^2 = 1
Two points give an exact line, so two is the minimum sample for a line. The singular values s are a quality measure: a tiny second value means the points are nearly collinear.
Worked check: points sampled without noise from recover exactly , which is divided by . A sign flip of all three numbers describes the same line.
The Weakness: Outliers
Squared error punishes large residuals heavily, so a handful of points far from the line can drag the fit away from the true structure. A single arbitrarily bad point can move the result arbitrarily far (breakdown point 0).
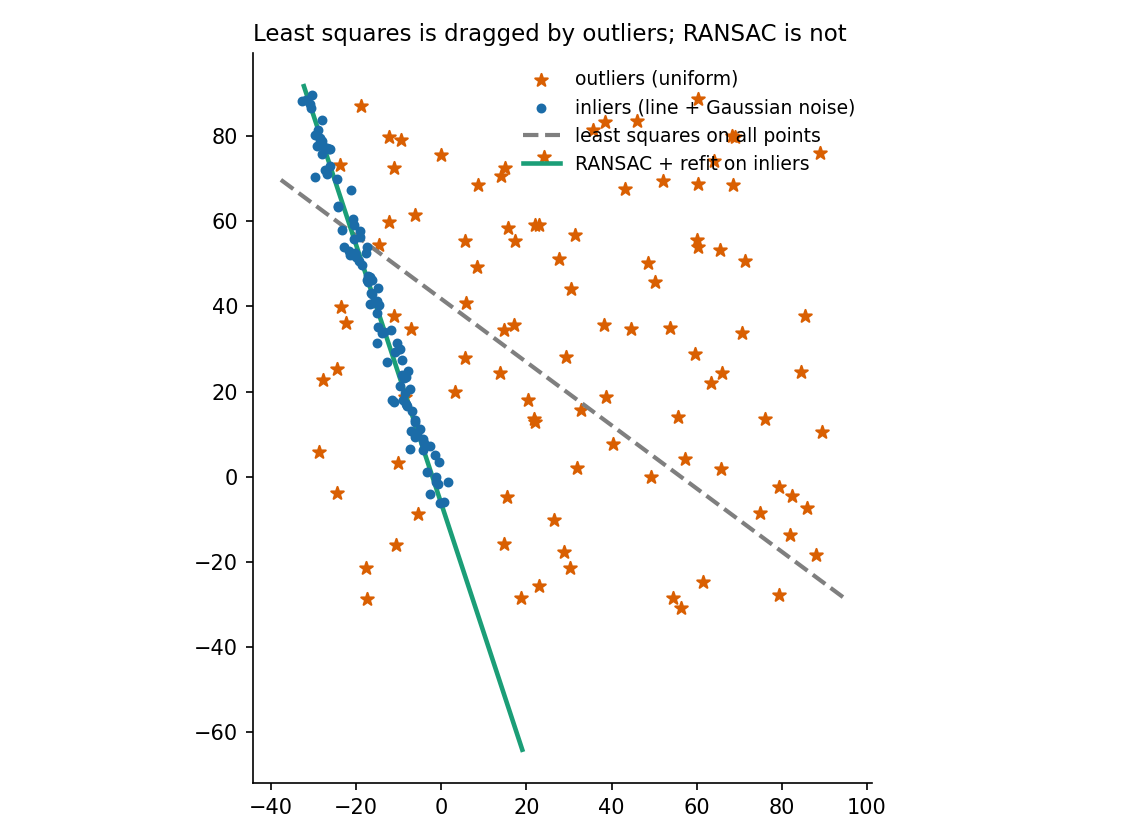
100 points on a noisy line plus 100 uniformly scattered outliers. The least-squares line (dashed) is pulled far off the true line by the outliers; RANSAC ignores them (RANSAC).
Robust alternatives either downweight outliers (M-estimators, Huber loss), minimize a median of residuals, or search for a consensus set as in RANSAC.
Related: Computer Vision MOC, RANSAC, RANSAC Snippets