Disclaimer: Please check the sources. The figures here come from a mix of primary pages, news summaries, and my own arithmetic, and the field changes quickly. See Verification Status for how much confidence each claim deserves, and confirm important numbers against the linked originals before relying on them.
How much electricity do AI models use, and is the recent surge unusual compared with history? Short answer: a single chatbot query is cheap, but total data centre demand has shifted from flat to fast growth, driven by building and running AI at very large scale.
The Historical Baseline: Flat Despite Exploding Compute
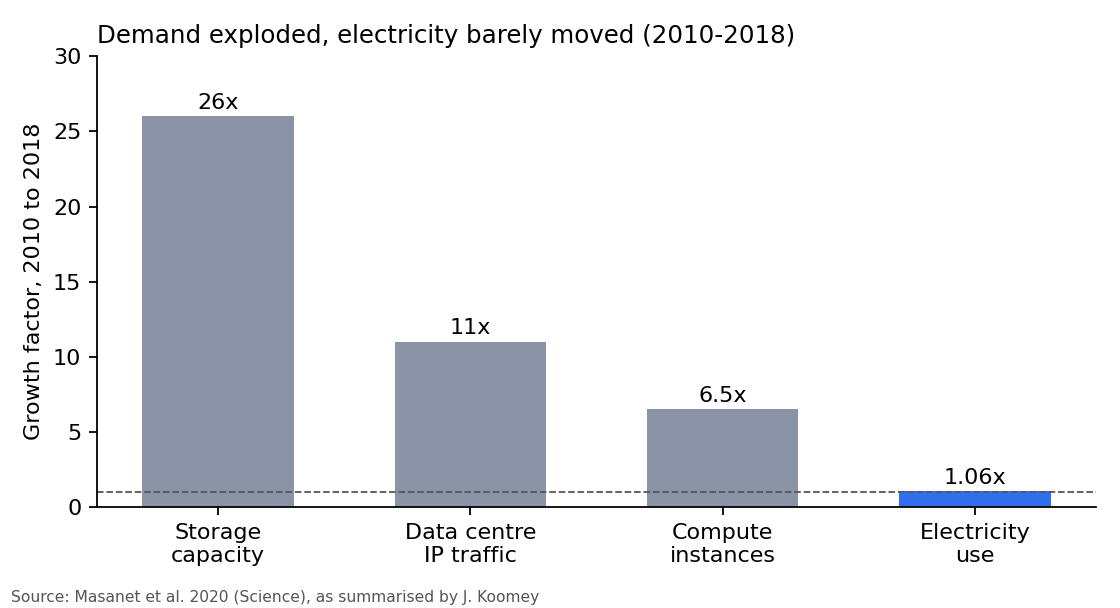
From 2010 to 2018, global data centre electricity use rose only about 6% (194 to 205 TWh, about 1% of world electricity) while compute instances grew 6.5x, installed storage 26x, and data centre IP traffic 11x. Efficiency gains absorbed almost all of the growth:
- Power Usage Effectiveness (PUE) improved by roughly 25%.
- Server energy intensity fell by about a factor of 4, and servers per workload by a factor of 5.
- Storage energy per TB fell by almost a factor of 10.
- Energy per compute instance fell about 20% per year.
- Workloads moved from small inefficient server rooms to hyperscale facilities.
Source: Masanet et al., 2020, Science; summary in Koomey’s blog.
The Recent Spike
| Period | Global data centre electricity | Growth rate |
|---|---|---|
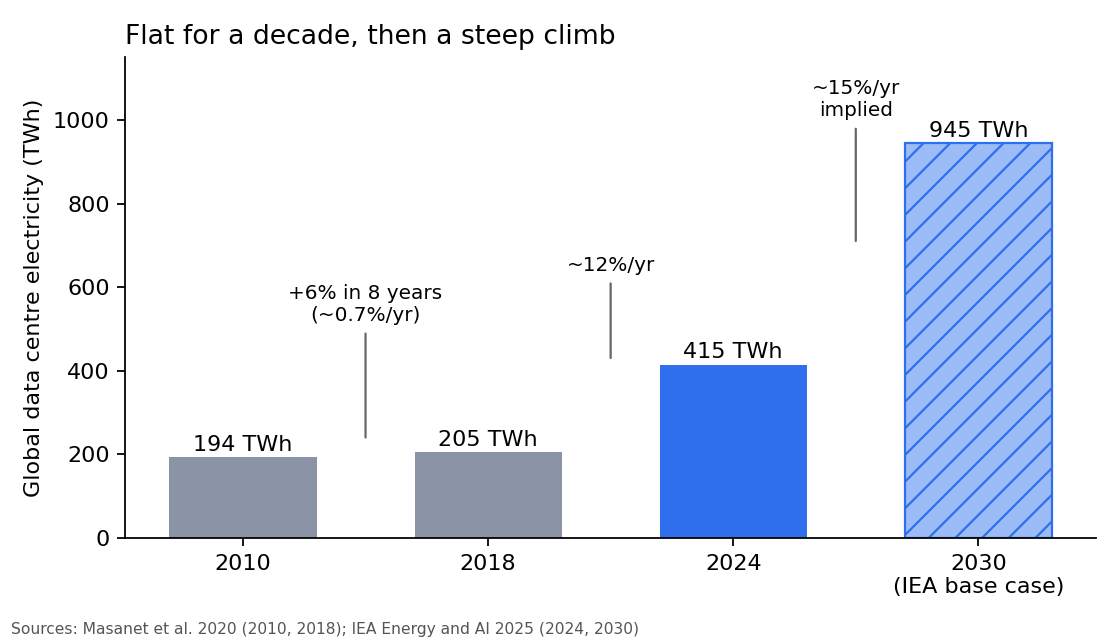
| 2010 to 2018 | 194 to 205 TWh | about 0.7% per year |
| 2017 to 2024 | 415 TWh in 2024 (about 1.5% of world electricity) | about 12% per year, over 4x faster than total electricity demand |
| 2024 to 2030 (IEA base case) | about 945 TWh, slightly more than Japan’s total consumption today | about 15% per year implied |
The annual rates for 2010-2018 and 2024-2030 are my own calculations from the endpoints. IEA identifies AI as the most important driver, with the US and China making up nearly 80% of projected growth. Data centres account for about one-tenth of global demand growth to 2030, but over 20% in advanced economies.
United States (LBNL, 2024 report): 58 TWh in 2014, 176 TWh in 2023 (4.4% of US electricity), and a projected 325 to 580 TWh by 2028 (6.7 to 12%). That works out to roughly 13% per year up to 27% per year, versus roughly 13% per year over 2014 to 2023.
So the pre-AI decade was an exception where efficiency kept pace with demand. Since about 2017 demand has outrun efficiency, and the projections for the AI build-out are steeper still.
Sources: IEA, Energy and AI (executive summary); US DOE on the LBNL report.
Historical Analogies: Is This Unprecedented?
Compared with the last great electrification wave, the growth rate is high but not unique, while the speed of build-out and concentration are.
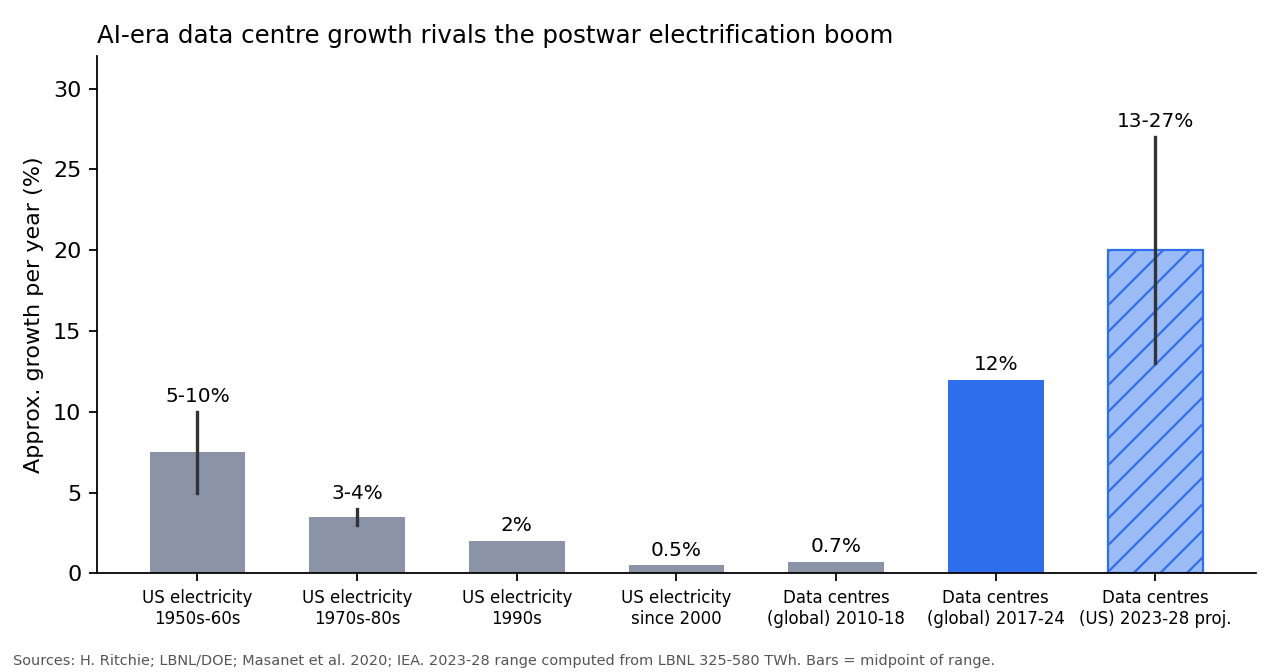
US electricity demand overall grew more than 5% in most years of the 1950s and 1960s, often close to 10%. It slowed to 3 to 4% in the 1970s and 1980s, about 2% in the 1990s, and has been close to flat since 2000. Data centres growing 13 to 27% per year are therefore far above the economy-wide postwar rate, but they start from a small base (4.4% of US electricity in 2023). Hannah Ritchie’s reading is that the percentage growth in total US demand now expected is “not unprecedented”, while the absolute additions (potentially 150 to 250 TWh per year in the 2030s) would be a distinctive period. Source: Hannah Ritchie, How unprecedented is power demand growth in the United States?
Relative to other demand drivers (global, 2024 to 2030):
| Driver | Added demand |
|---|---|
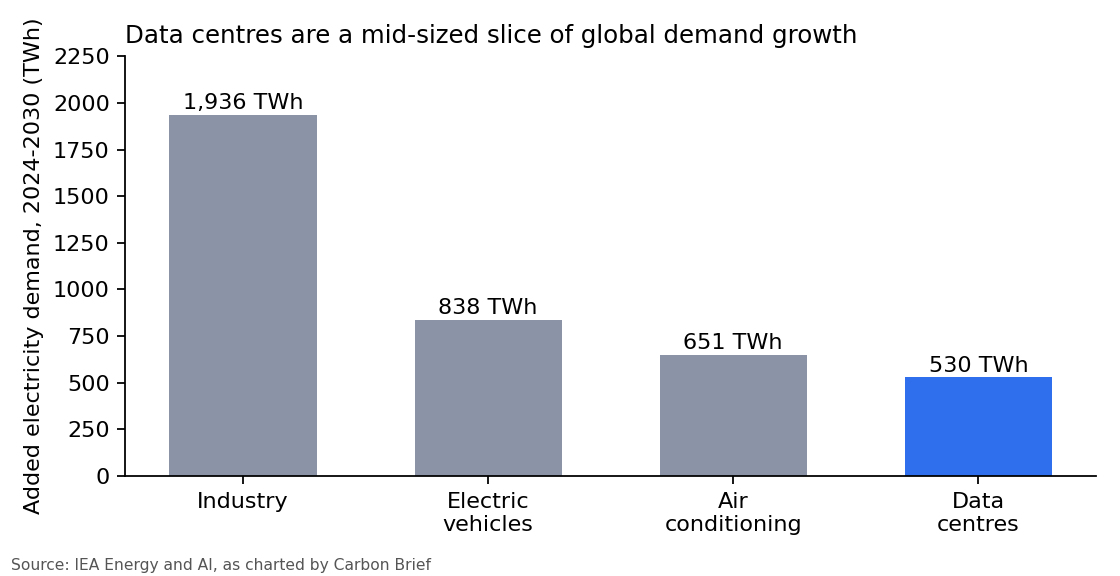
| Industry | 1,936 TWh |
| Electric vehicles | 838 TWh |
| Air conditioning | 651 TWh |
| Data centres | about 530 TWh (8% of global growth; 12% in faster-growth scenarios) |
Globally AI is mid-sized next to the wider electrification of transport, buildings and industry. The story is local concentration: data centres are 21% of Ireland’s electricity, 26% of Virginia’s, and are projected to drive about half of US and Japanese demand growth to 2030. Source: Carbon Brief, five charts on data-centre energy.
Industrial Revolution parallels. I did not find a rigorous quantitative comparison between AI and the first Industrial Revolution. The qualitative parallels people draw:
- A general-purpose technology (steam, then electricity, then computing) whose energy use is a means to broad productivity change, not an end.
- Efficiency gains raising total consumption (Jevons paradox, first described for coal and steam engines). Cheaper tokens increase usage, as noted below.
- Timing differs sharply: major energy transitions historically took decades (coal rose from a tiny share of world energy in 1800 to about half by 1900, per a secondary summary I could not verify). AI data centre campuses are planned in a few years and can draw as much power as an industrial city or aluminum smelter, which strains grid planning more than the totals suggest.
Training: Power Doubling Each Year
Epoch AI estimates the electrical power drawn by frontier training runs has grown about 2x per year (90% interval 1.7 to 2.4x), using 45 frontier models since 2010.
| Model | Year | Estimated training power |
|---|---|---|
| GPT-3 | 2020 | about 4.8 MW |
| Grok 3 | 2025 | about 110 MW (about 23x GPT-3) |
Training compute grows about 4x per year, so power grows slower than compute because of three offsets: hardware efficiency (about 12x over ten years), lower-precision number formats (about 8x), and longer training runs at lower power (about 4x). Together they cut power per unit of compute by about 2x per year.
Source: Epoch AI, Power growth in frontier AI training.
Inference: Energy per Query
| Source | Estimate | Notes |
|---|---|---|
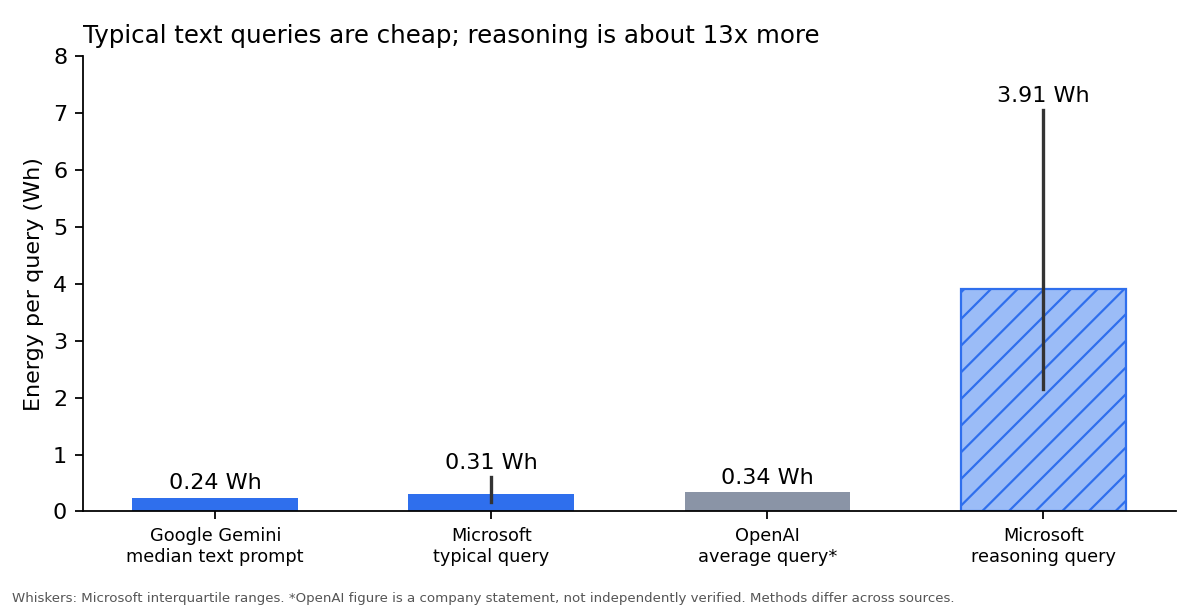
| Google (2025) | 0.24 Wh per median Gemini text prompt | Measured across serving infrastructure; 33x lower than a year earlier, thanks to model, software, and hardware efficiency |
| Microsoft Research (Joule, 2026) | 0.31 Wh typical query (about 300 tokens); 3.91 Wh for long reasoning responses | Bottom-up model; reasoning IQR 2.15 to 7.05 Wh |
| OpenAI (company statement) | about 0.34 Wh average ChatGPT query | Reported secondhand; not independently verified |
Takeaways:
- Reasoning models cost roughly an order of magnitude more per query (about 13x in the Microsoft estimate) because they generate many hidden thinking tokens. See Large Language Models and KV Cache for why more generated tokens means more compute and memory traffic.
- Estimates vary widely with prompt length, hardware, batching, and what is counted (cooling and overhead included or not). Treat any single figure as an order of magnitude.
- Early 2023 estimates of around 3 Wh per ChatGPT request circulated widely (recalled from memory, not re-checked). Measured figures from operators are now closer to 0.3 Wh, an example of fast per-query efficiency gains.
Back-of-envelope scale check: 1 billion queries per day at 0.3 Wh is about 0.11 TWh per year, roughly 0.03% of the 415 TWh data centre total. Microsoft’s own scaling matches: 1 billion queries per day is about 0.7 GWh per day for a baseline system, or 0.3 GWh per day with optimizations (the 0.3 GWh case is the 0.11 TWh per year above). Plain text chat is a small slice. The big loads are training clusters, reasoning and agentic workloads that multiply tokens per task, image and video generation, and the general build-out of AI-dedicated capacity.
Sources: Google, Measuring the environmental impact of delivering AI at Google scale; Microsoft study coverage (ESG Post); How Hungry is AI? (benchmarking study).
Why the Trend Broke
- Efficiency headroom ran out: the 2010-2018 gains (consolidation to hyperscale, PUE near its floor, virtualization) were one-time wins.
- Accelerators draw far more power per rack than general-purpose servers.
- Scaling laws reward more compute: bigger models and longer training, then test-time scaling (reasoning) on the inference side.
- Demand growth: hundreds of millions of daily users, plus embedding of LLMs into search, coding, and agents.
- Jevons effect: cheaper per-query cost increases total usage.
Verification Status
This topic mixes measured data, secondhand summaries, and my own arithmetic. Treat the confidence column as part of the note.
| Claim | Confidence | Basis |
|---|---|---|
| Global data centres: 415 TWh in 2024, about 1.5% of world electricity, about 12% per year since 2017, 945 TWh by 2030 | High | Read directly on the IEA executive summary |
| 2010 to 2018: 194 to 205 TWh, compute 6.5x, storage 26x, traffic 11x, PUE and server efficiency gains | High | Read on Koomey’s summary of the Science paper (a co-author). The paper itself was not accessible, so the original was not checked |
| US: 58 TWh (2014), 176 TWh (2023, 4.4%), 325 to 580 TWh (2028) | High | Read on the US DOE page summarizing the LBNL report |
| Frontier training power about 2x per year; GPT-3 about 4.8 MW; Grok 3 about 110 MW | Medium-high | Read on the Epoch AI page. Another Epoch publication cited 2.2x per year, so the exact rate depends on the dataset and date |
| Google: 0.24 Wh per median Gemini text prompt, 33x lower in one year | High (for Google’s own serving stack) | Read in the paper abstract. A company self-measurement, not independently audited |
| Microsoft: typical query 0.16 to 0.60 Wh range, 0.7 to 0.3 GWh per billion queries per day, published in Joule (June 2026) | Medium | Read on a news summary (ESG Post), not the paper |
| Microsoft: 0.31 Wh median, 3.91 Wh reasoning (IQR 2.15 to 7.05) | Medium-low | Appeared only in search-result summaries; the reasoning figure was not confirmed on a page I opened |
| OpenAI: about 0.34 Wh per query | Low | Secondhand report of a company statement |
| Growth by driver (industry, EVs, AC, data centres), regional shares (Ireland 21%, Virginia 26%) | Medium-high | Read on Carbon Brief, which charts IEA data |
| US electricity growth by decade (5 to 10%, 3 to 4%, about 2%) | Medium | Read on Hannah Ritchie’s analysis. The “about 0.5% per year since 2000” figure came from a search snippet only |
| Coal share rising from a tiny share in 1800 to about half by 1900 | Low | Search snippet; source page not accessible |
| Early estimate of about 3 Wh per ChatGPT request | Low | From memory, also seen in a secondary snippet; not checked |
| Growth rates of 0.7%, about 15%, 13%, and 13 to 27% per year; the 0.03% scale check | Derived | My own arithmetic from the endpoints above. The query volume (1 billion per day) is an assumption |
Cross-source caution: Google, Microsoft, and OpenAI figures use different scopes (production median versus modeled estimate; cooling and overhead included or not), so they are not directly comparable.
Caveats
- Projections span a wide range (IEA 2035 scenarios run from 700 to 1,700 TWh).
- Companies disclose little; many figures are bottom-up estimates.
- Electricity is only part of the footprint; water, embodied hardware carbon, and grid carbon intensity matter too.
Related Notes
- Large Language Models - Scale and training of LLMs.
- KV Cache - Inference-time memory optimization that reduces cost per generated token.
- Attention & Transformers - Quadratic attention cost as a source of compute demand.
- Brief History & Model Types - Generative model timeline.